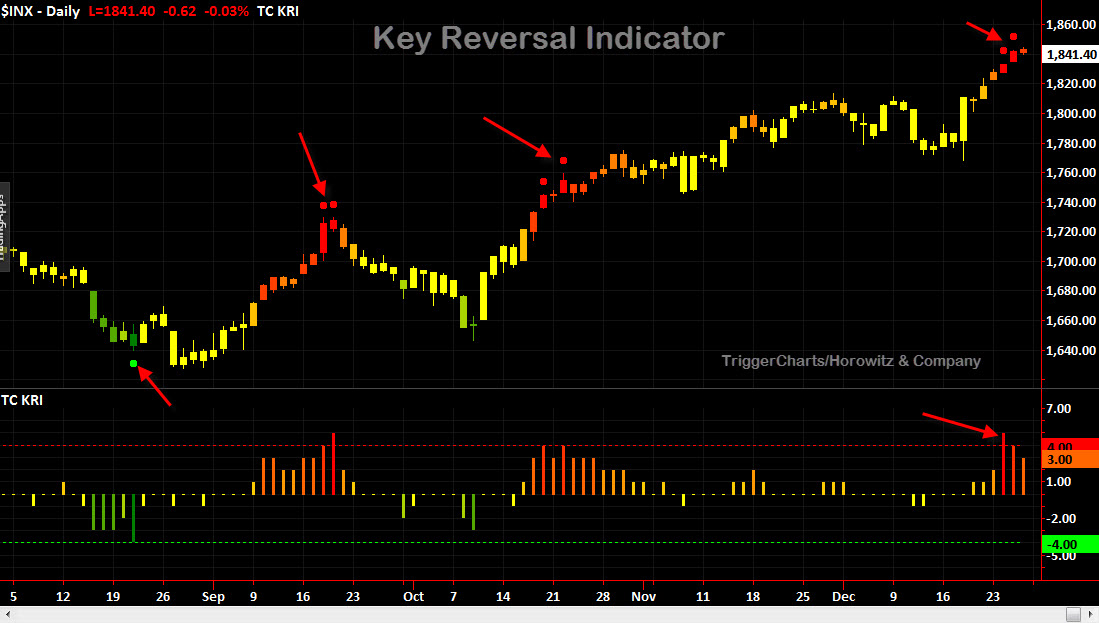
We mentioned this in this week’s TDI Podcast episode (If you have not listened yet, you should…) There is a overheated reading on the Key Reversal Indicator and clusters forming.
Note that the chart below provides some of the recent history of the S&P 500 and the turning points. Now, not all overheated readings will result in a major correction, but they do point to a period where a change of short-term direction may occur. We have tested this back in time and it has a high degree of accuracy. The oversold readings at extremes are quite consistent in foreseeing the lows. The high points are a bit tougher to discern, but readings over 5 should be watched.
Click to enlarge
Here is a longer view…
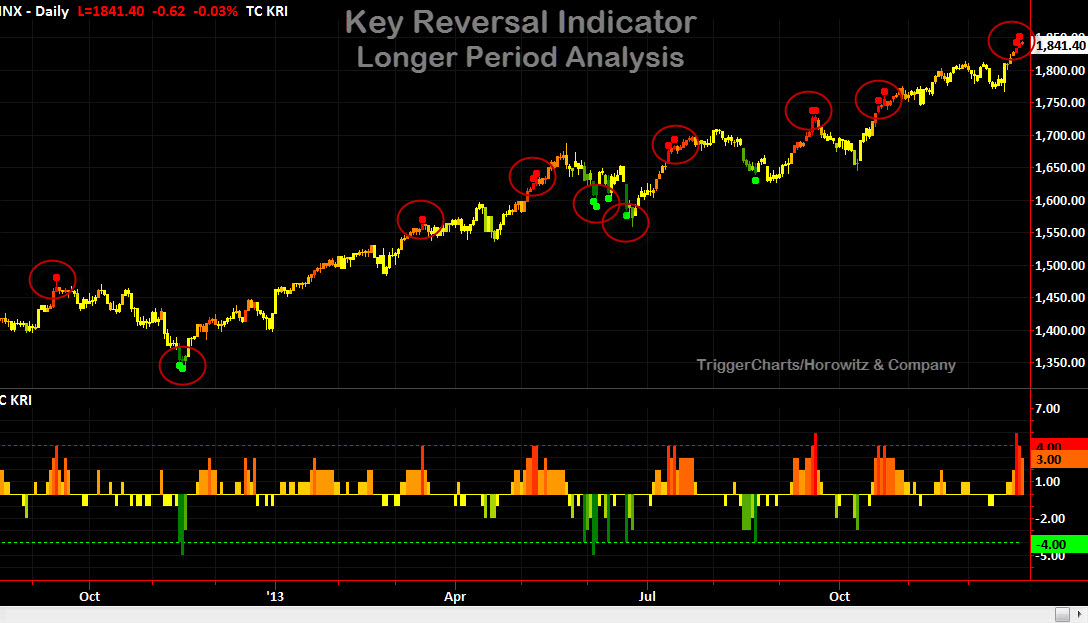
The KRI Indicator is available on the TradeStation TradingApp Store