We often discuss the Spearman Indicator as well as other important technical levels as inflection points begin to appear. So far this year, there has only been one significant reversal that occurred right on the first trading day of 2013. Other than that, there has not been reading that could be seen as a signal to worry too much as the trend/grind has been somewhat consistent. However, there are indications that the recent run-up has reached a point that we have to say that there is a need for some of the froth to settle.
The Spearman Indicator is reaching highs that are indicative of an overheating condition. While we know that there can be times that buying/selling pressure can be sustained with readings over 75, it is not too long after that there is a pause/pullback to bring the reading lower.
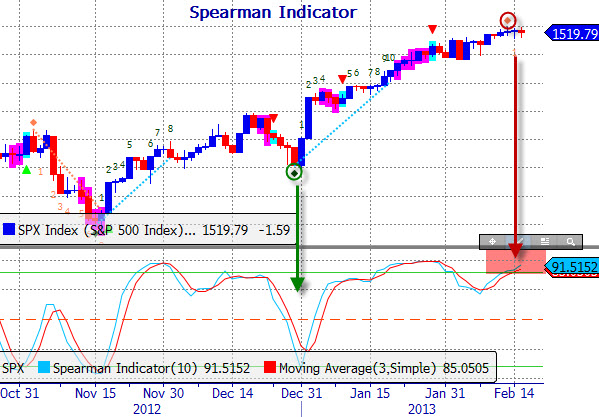
As far as the Candle Sessions study is concerned, this reversal indicator is based on Japanese candlestick counting. An underlying trend is established by comparing consecutive down/up candles to identify the Record Session Low/High. Thereafter a sequence of opposite moving candles based on High/Low breaks are recorded until the maximum count is reached or until a new Record Session Low/High is found. Potential reversals tend to occur at counts of 8, 10 or 13. The current count is now a “1” on a downside reversal indication.
But wait, there is more….
The McClellan Oscillator has been struggling to stay above zero. According to this indicator, there was an overbought condition that began at the beginning of the year and then has been slowly working its way back toward the zero line. The pattern recently shows a complex structure below the zero line that appears to be tilting towards a bearish level.
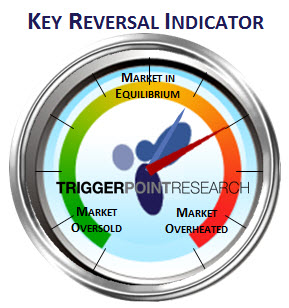
The Key Reversal Indicator (KRI) has also been creeping higher. Now at a +2, this is significant, although perhaps not indicative of an immediate reversal. Still, it is confirming the other indicators that we are watching across U.S. equity markets.
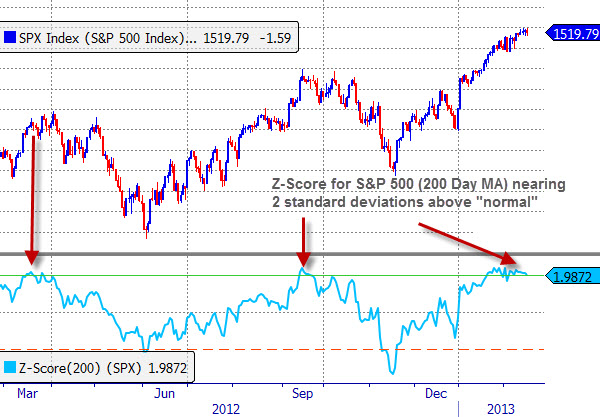
Then there is the Z-Score. This measures the distance in units of standard deviations of the close as compared to the moving average of this line. For example, if a Moving Average of period 20 is applied to the Close, a Z-Score value of 2.37 indicates that the close is 2.37 standard deviations away from the moving average at that point.
This indicator is based on the same theory as Bollinger Bands, but generates an alternative measurement that can then be interpreted and used to make determinations about market action.
Currently, the Z-Score for the 200-day moving average is just about 2. This means that the price of the S&P 500 is 2 standard deviations above the historical average of the 200-day moving average.
All told, the technical indicators are flashing some important news. At the same time, we are seeing the crisis in Europe sparking up again, currency wars beginning and the month end fiscal cliff decision approaching. You make the call…..
——
Live and Alerting

(Click the above for more information)