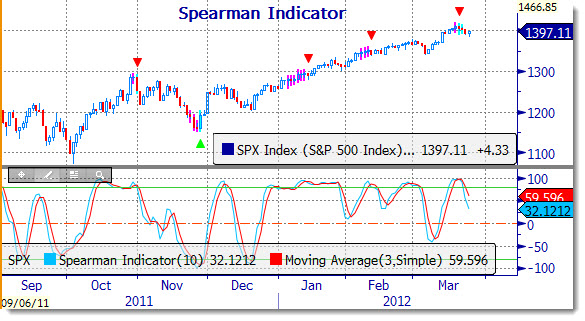
The Spearman Indicator is like the “boy crying wolf” lately. But let’s not get too comfortable/complacent.
We need to put into the proper perspective the level and the direction to see what we can determine from the signal. As we have discussed previously, the rolling-up or -over of the indicator, above/below the moving average is one important condition, but the level (above or below zero) is where the indicator is designed to provide a proper signal.
From the chart below, there is confirmation by the Bloomberg Trend/Stall study that a near-term high was reached and now a stalling condition is present. The Spearman is also rolling down. Now to get a confirmation, the Spearman needs to dip below the zero line.
That may occur with a couple of more stall days or a turn sharply lower (greater than 1%) on the S&P 500 index. That may be a time to either hedge out or consider lightening up long positions. From there, a short could be implemented through an ETF or options strategy.
Just a quick heads up….
The Bloomberg Trend/Stall Indicator:
TrendStall identifies points at which a trend is losing momentum and is likely to stall or consolidate. The determination is based on a Rate of Change of the ADX. The parameters for the ADX, Rate of Change, and Moving Average of the Rate of Change are user adjustable.
The bar that has been determined to be the ‘Stall’ point is marked by a triangle above or below that bar. The price bars leading up to a TrendStall signal are painted a different color to alert the user that the TrendStall histogram has risen above the threshold level confirming a trend is in place and a stall is imminent. The period after the stall bar may also be painted on the price chart, depending on the value of the histogram (ADX ROC) in relation to a moving average of that value. This ‘paintbar’ period is often valuable as an indication of a slightly longer stall confirmation.


