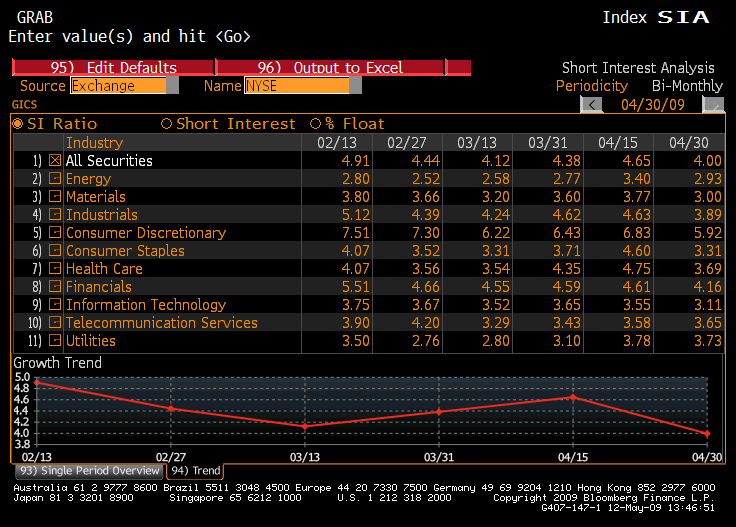
As of April 30, 2009 bearish bets or short interest on the market has decreased beyond their March 13th lows. In the chart below, a red line indicates the change in the short interest ratio. The short interest ratio can be calculated by taking the total short interest divided by the average daily shares traded for that particular sector or security. Some see this ratio as the number of days it would take for all the short sellers to move out of there position if the stock were to move sharply higher, thus creating a short squeeze.

In the chart above you will see the short interest ratio rising almost a full percent from 3/13 – 4/15 as the market moved higher. During this time Bears were placing stakes that the rally would not last. From 4/15 – 4/30 the short interest decreased sharply indicating that bears were covering their positions, causing the market to rally substantially higher. It is possible the market has overextended itself due to this short squeeze and we may see some correction in the near future. We will continue to monitor the growth trend of the short ratio across all sectors for any clues of a possible retracement.
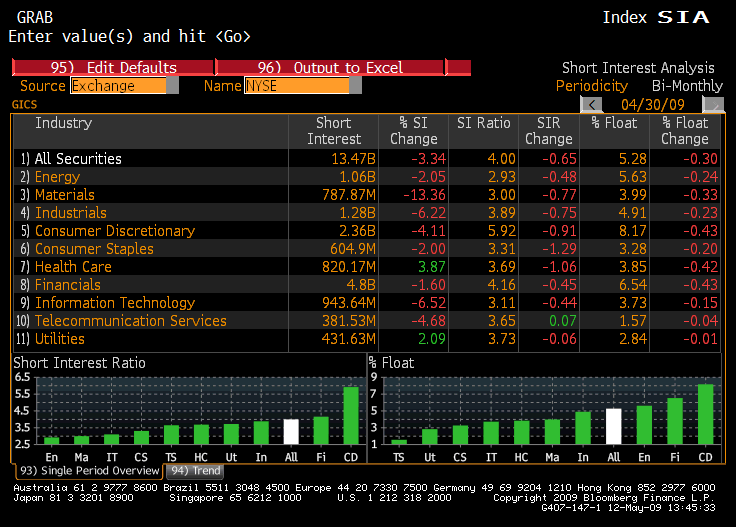
By sector the most short interest which is not surprising can be found in the financial sector with 4.8 Billion shares, with consumer discretionary and industrials not too far behind at 2.36 and 1.2 Billion respectively. We are almost certain that over the past few weeks this information has changed dramatically as stress tests on the banks seemed to pass, even if unwarranted causing a short squeeze amongst most of the major banks.
We have made several plays in the consumer discretionary sector with our short positions in Joseph A. Banks (JOSB) and Abercrombie & Fitch (ANF). This sector has the highest short interest ratio which generaly is a bearish signal and signifies that we are not the only ones who feel this area is overvalued.


