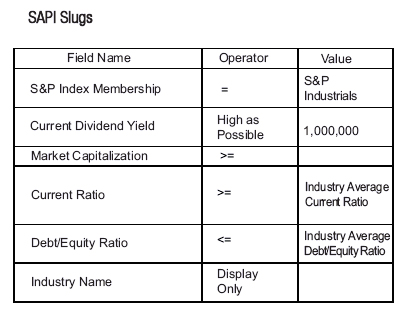
S&P Index Slugs (SAPI Slugs) Adapted from Pages 44-45 of The Disciplined Investor – Essential Strategies for Success
According to MSN Money, this simple but effective value search presents a pure yield play. It is similar but potentially superior to the better-known “Dogs of the Dow” search we reviewed on November 14th because it draws from a wider pool of large-cap stocks and includes a secondary financial-strength overlay.
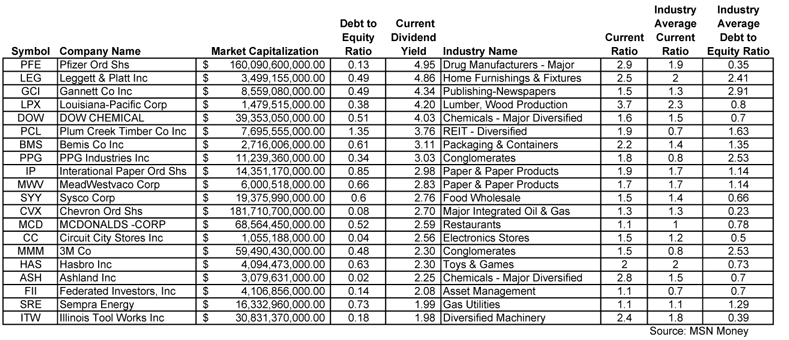
The search was also developed and tested by money manager and author Jim O‘Shaughnessy. The strategy calls for buying the top 20 stocks from the result set of this search, ranked by dividend yield. These should be held for 1 year and then rescreened and rebalanced. It can be combined with O‘Shaughnessy‘s Momentum Growth search to create a balanced 30-stock, 1-year portfolio. This search criteria and others are available in the stock screener section of the MSN Money website and can also be downloaded from The Disciplined Investor website. Below is the criteria used to create the screen with the MSN Money Deluxe Screener.
The theory of using more than one screen is to allow for greater diversification within the portfolio. This way, if one particular screening method is sorely out of favor, the other may help to avoid massive losses. In his research, O‘Shaughnessy built portfolios for one year each. Translated, this means that once you buy the resulting stocks and effectively hold them for 52 weeks, you can rerun the screen to find the stocks to include in the next cycle.For most individual investors, this is a tedious task and can result in excessive trading fees. Also, as has been discussed, the tax implications alone could be extremely detrimental to a portfolio‘s performance. This is precisely why these methods are often used within tax-deferred accounts along with additional fundamental overlays. Suffice it to say that these screens should be used as initial idea generators, not as absolute methodologies.
Click Table to Enlarge
The theory of using more than one screen is to allow for greater diversification within the portfolio. This way, if one particular screening method is sorely out of favor, the other may help to avoid massive losses. In his research, O‘Shaughnessy built portfolios for one year each. Translated, this means that once you buy the resulting stocks and effectively hold them for 52 weeks, you can rerun the screen to find the stocks to include in the next cycle. For most individual investors, this is a tedious task and can result in excessive trading fees.
Also, as has been discussed, the tax implications alone could be extremely detrimental to a portfolio‘s performance. This is precisely why these methods are often used within tax-deferred accounts along with additional fundamental overlays. Suffice it to say that these screens should be used as initial idea generators, not as absolute methodologies.
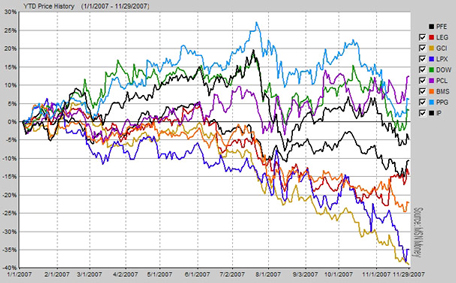
This chart shows a 1-Year price performance for the 10 highest yielding stocks within the SAPI Slugs using the above screening criteria.
* There are many more screens along with additional strategies available within the pages of The Disciplined Investor.
Note: Horowitz & Company clients may hold long or short positions in any position mentioned.